
MyoSpectrum
MyoSpectrum is an integrative transcriptional atlas of human skeletal muscles spanning healthy and myopathic conditions.
WARNING
This project V1.0 has been archived and is no longer updated.
Overview
On April 10, 2024, Communications Biology published a collaborative study by the neuromuscular disease team at Huashan Hospital together with the University of Helsinki, University of Campania, University of Western Australia, and Karolinska Institute. This study revealed the myopathy spectrum linking transcriptional expression and clinical phenotypes across 1,221 human skeletal muscles through integrative analysis.
Background
Myopathies refer to a large group of debilitating diseases affecting the human skeletal muscle system. They are generally genetic in origin and mostly classified as rare diseases. Bulk RNA-seq, as a fundamental sequencing method, can capture the instantaneous transcriptional physiological state of muscles. Although it has been applied in myopathy research, published data lack integration, and the association between transcription and clinical features has not been systematically studied.
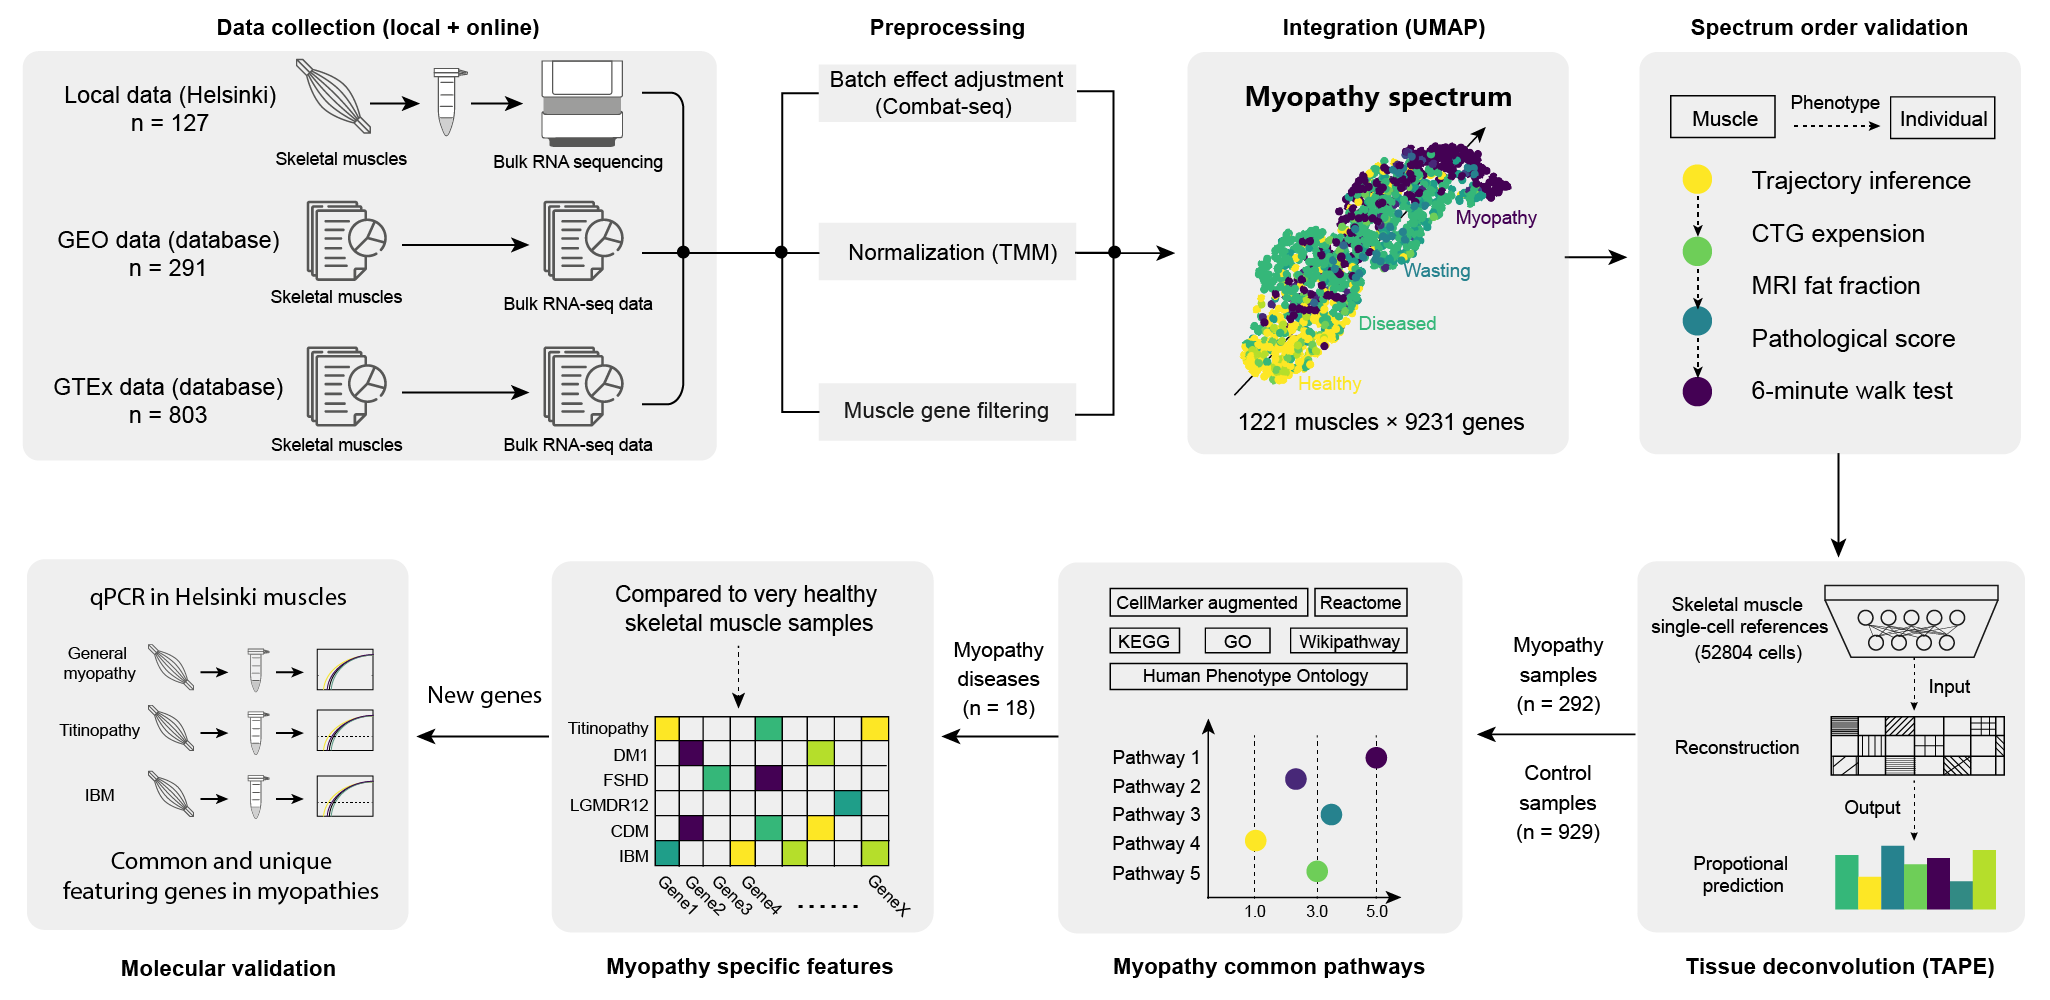
This study utilized RNA-seq data from GTEx, GEO databases, and local Helsinki human skeletal muscles (292 myopathy muscles and 929 control muscles), analyzing the transcriptomic data (9,231 genes) of 1,221 muscles and their shared associations with clinical phenotypes.
Study Design
This study incorporated Bulk RNA-seq data from different myopathies, sequencing methods, sequencing depths, and phenotypes, resulting in considerable dataset heterogeneity.
Similar to the "baimiao" technique in traditional Chinese ink painting, this study innovatively used unimportant blank space (controls) to highlight the main subject (myopathies). Because myopathies are mostly rare diseases (incidence typically below 1 in 100,000), population-based data from GTEx (n = 803) can serve as healthy controls. By leveraging GTEx-recorded donor causes of death and categorizing muscles accordingly, three types of controls were derived:
- Very healthy controls — accidental death without accompanying disease (n = 234)
- Generally unhealthy controls — death accompanied by general diseases (n = 470)
- Severely unhealthy controls — death accompanied by wasting diseases (n = 87)
This ultimately revealed a stepwise progressive transcriptional pattern.
Dataset
This study comprises 23 muscle phenotypes (8 control types, 15 myopathy types) and two sequencing methods: mRNA and total RNA.
| Phenotype | n | Sequencing | Source |
|---|---|---|---|
| Control (accident death) | 31 | mRNA | GTEx |
| Control (unexpected death) | 203 | mRNA | GTEx |
| Control (intermediate death) | 46 | mRNA | GTEx |
| Control (ventilator case) | 424 | mRNA | GTEx |
| Control (slow death) | 87 | mRNA | GTEx |
| Control (others) | 111 | mRNA/total RNA | GTEx/GEO |
| Control (amputee) | 24 | mRNA | Helsinki |
| Control (hyperCKemia) | 3 | mRNA | Helsinki |
| FSHD | 61 | total RNA | GEO |
| DM1 | 44 | total RNA | GEO |
| LGMD R12 | 41 | total RNA | GEO |
| CDM | 36 | total RNA | GEO |
| Titinopathy | 31 | mRNA | Helsinki |
| IBM | 28 | mRNA/total RNA | Helsinki/GEO |
| DMD | 5 | total RNA | GEO |
| BMD | 5 | total RNA | GEO |
| Actinin-2 myopathy | 5 | mRNA | Helsinki |
| Myopathy (HNRNPA1) | 5 | mRNA | Helsinki |
| SMPX myopathy | 4 | mRNA | Helsinki |
| Myopathy (unsolved) | 24 | mRNA | Helsinki |
Total: 1,221 muscles (929 controls + 292 myopathy)
The Transcriptional Myopathy Spectrum
After integrating all data, a distinctive transcriptional pattern of disease progression emerges:
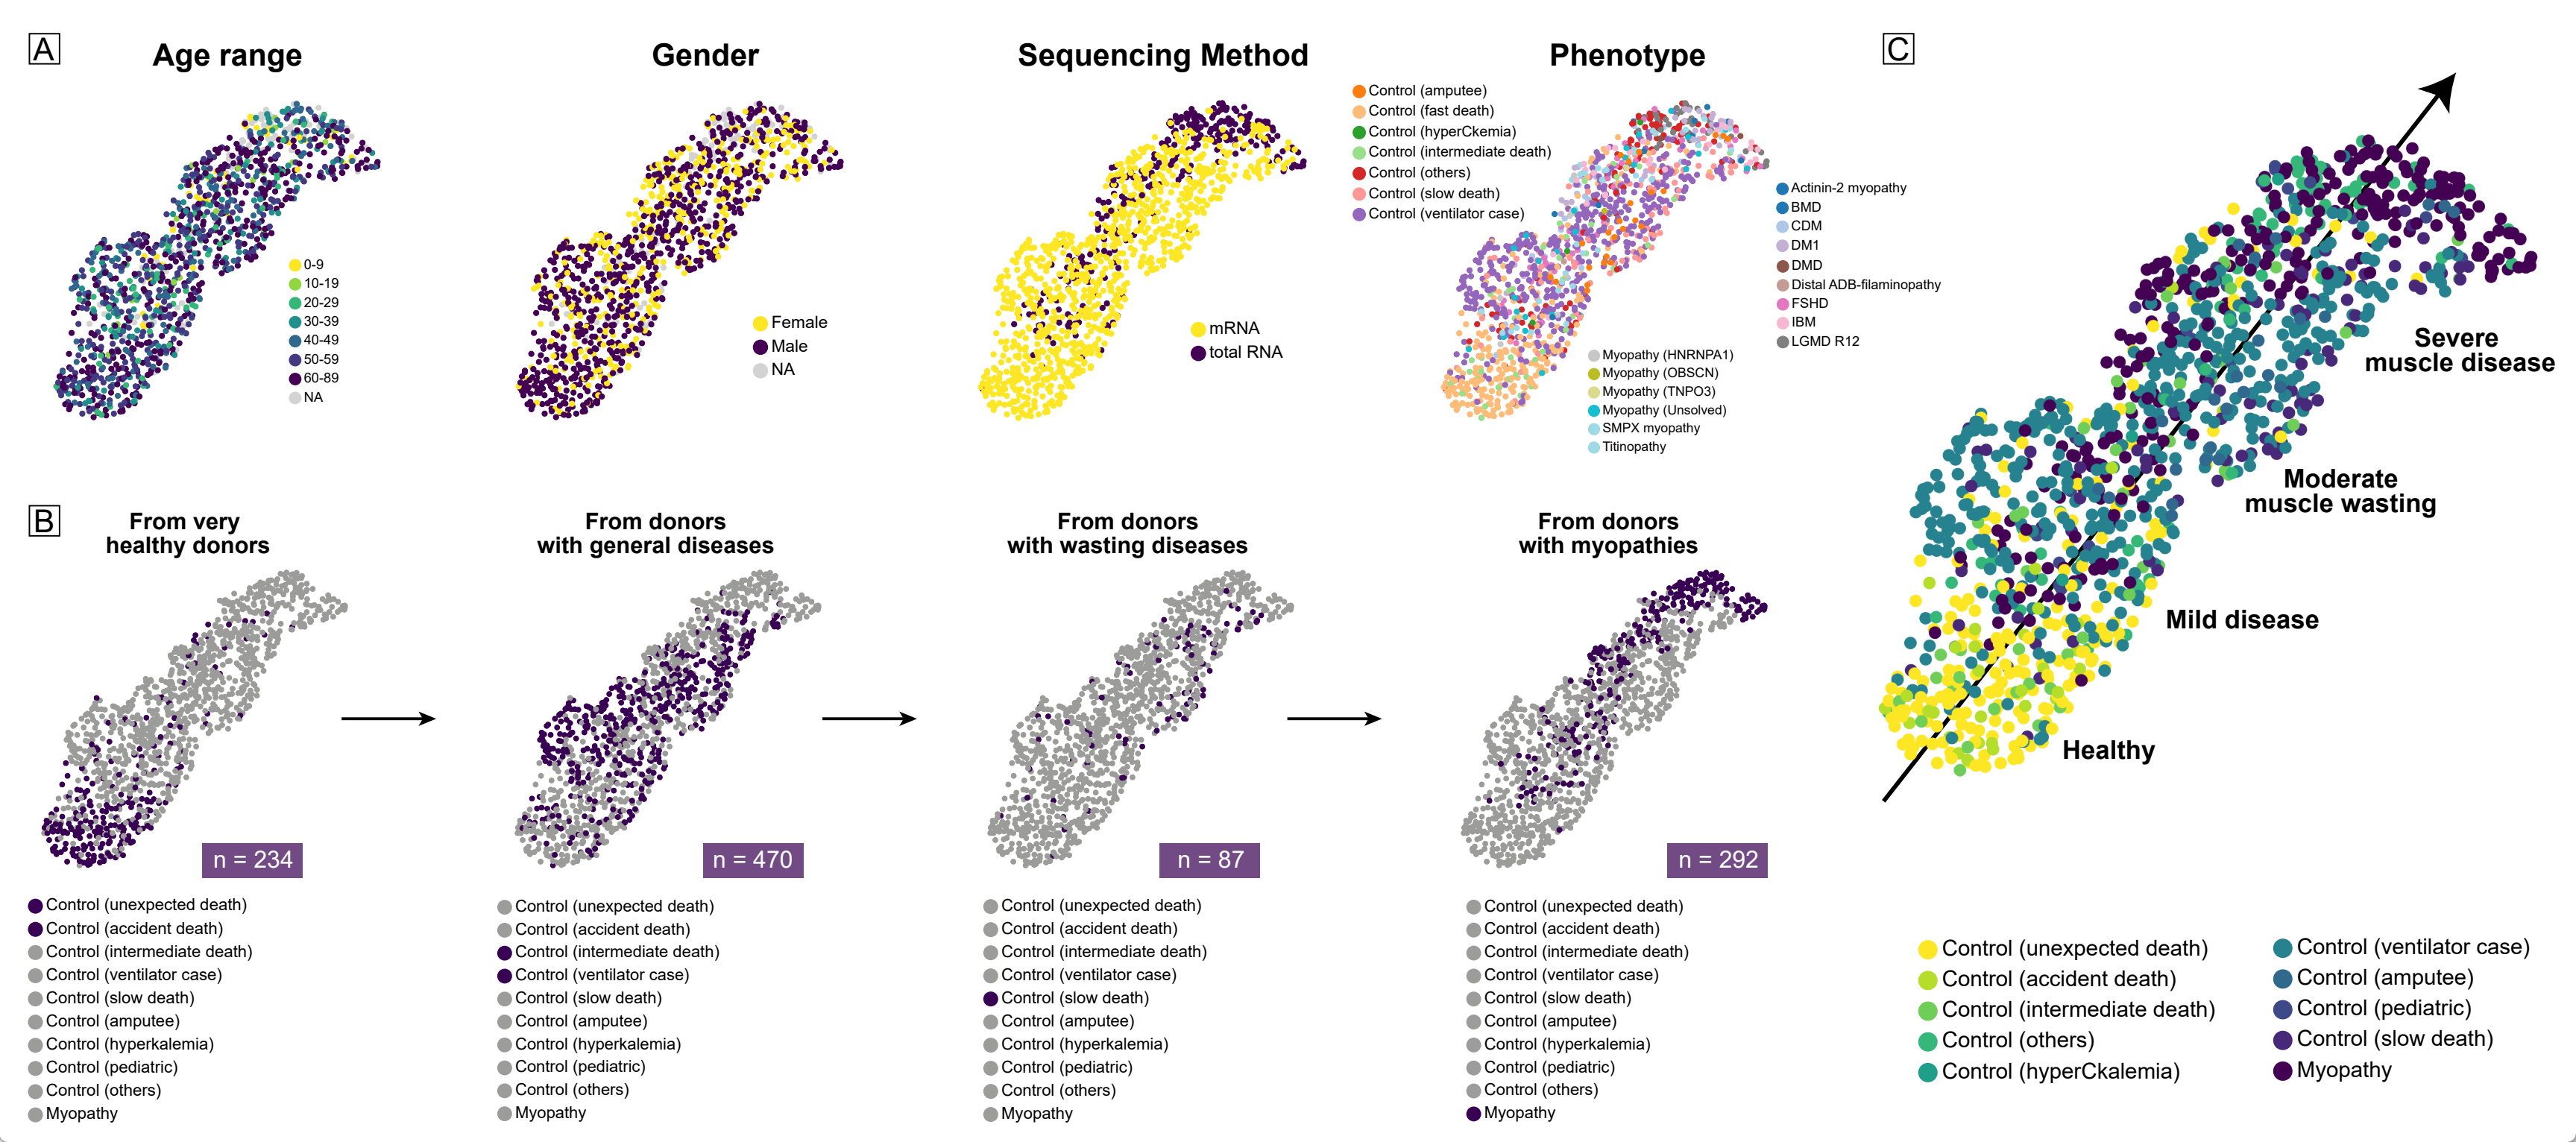
Spectrum progression order:
- Very healthy donors (death from accidents, suicide, etc., n = 234)
- Donors with general diseases (unhealthy at death, accompanied by various diseases, n = 470)
- Donors with wasting diseases (accompanied by wasting conditions such as cancer, tuberculosis, etc., n = 87)
- Myopathy patients (various common muscle diseases, n = 292)
Key Finding
Notably, myopathy muscles on the far right are not entirely unhealthy — some muscles (hyperCKemia, asymptomatic myopathy) intrude downward into the very healthy range, displaying transcriptional patterns similar to healthy controls. This is analogous to the asymptomatic pre-clinical stages observed in clinical practice.
Neither age, sex, sequencing method, nor myopathy type is a driving factor of the myopathy spectrum. Notably, Helsinki myopathy muscles (mRNA sequencing) and GEO myopathy muscles (total RNA sequencing) both cluster in the upper right, suggesting they share the same transcriptional pattern.
Clinical Validation
To verify whether the transcriptional progressive results have clinical significance, published myopathy data were used for multi-level validation.
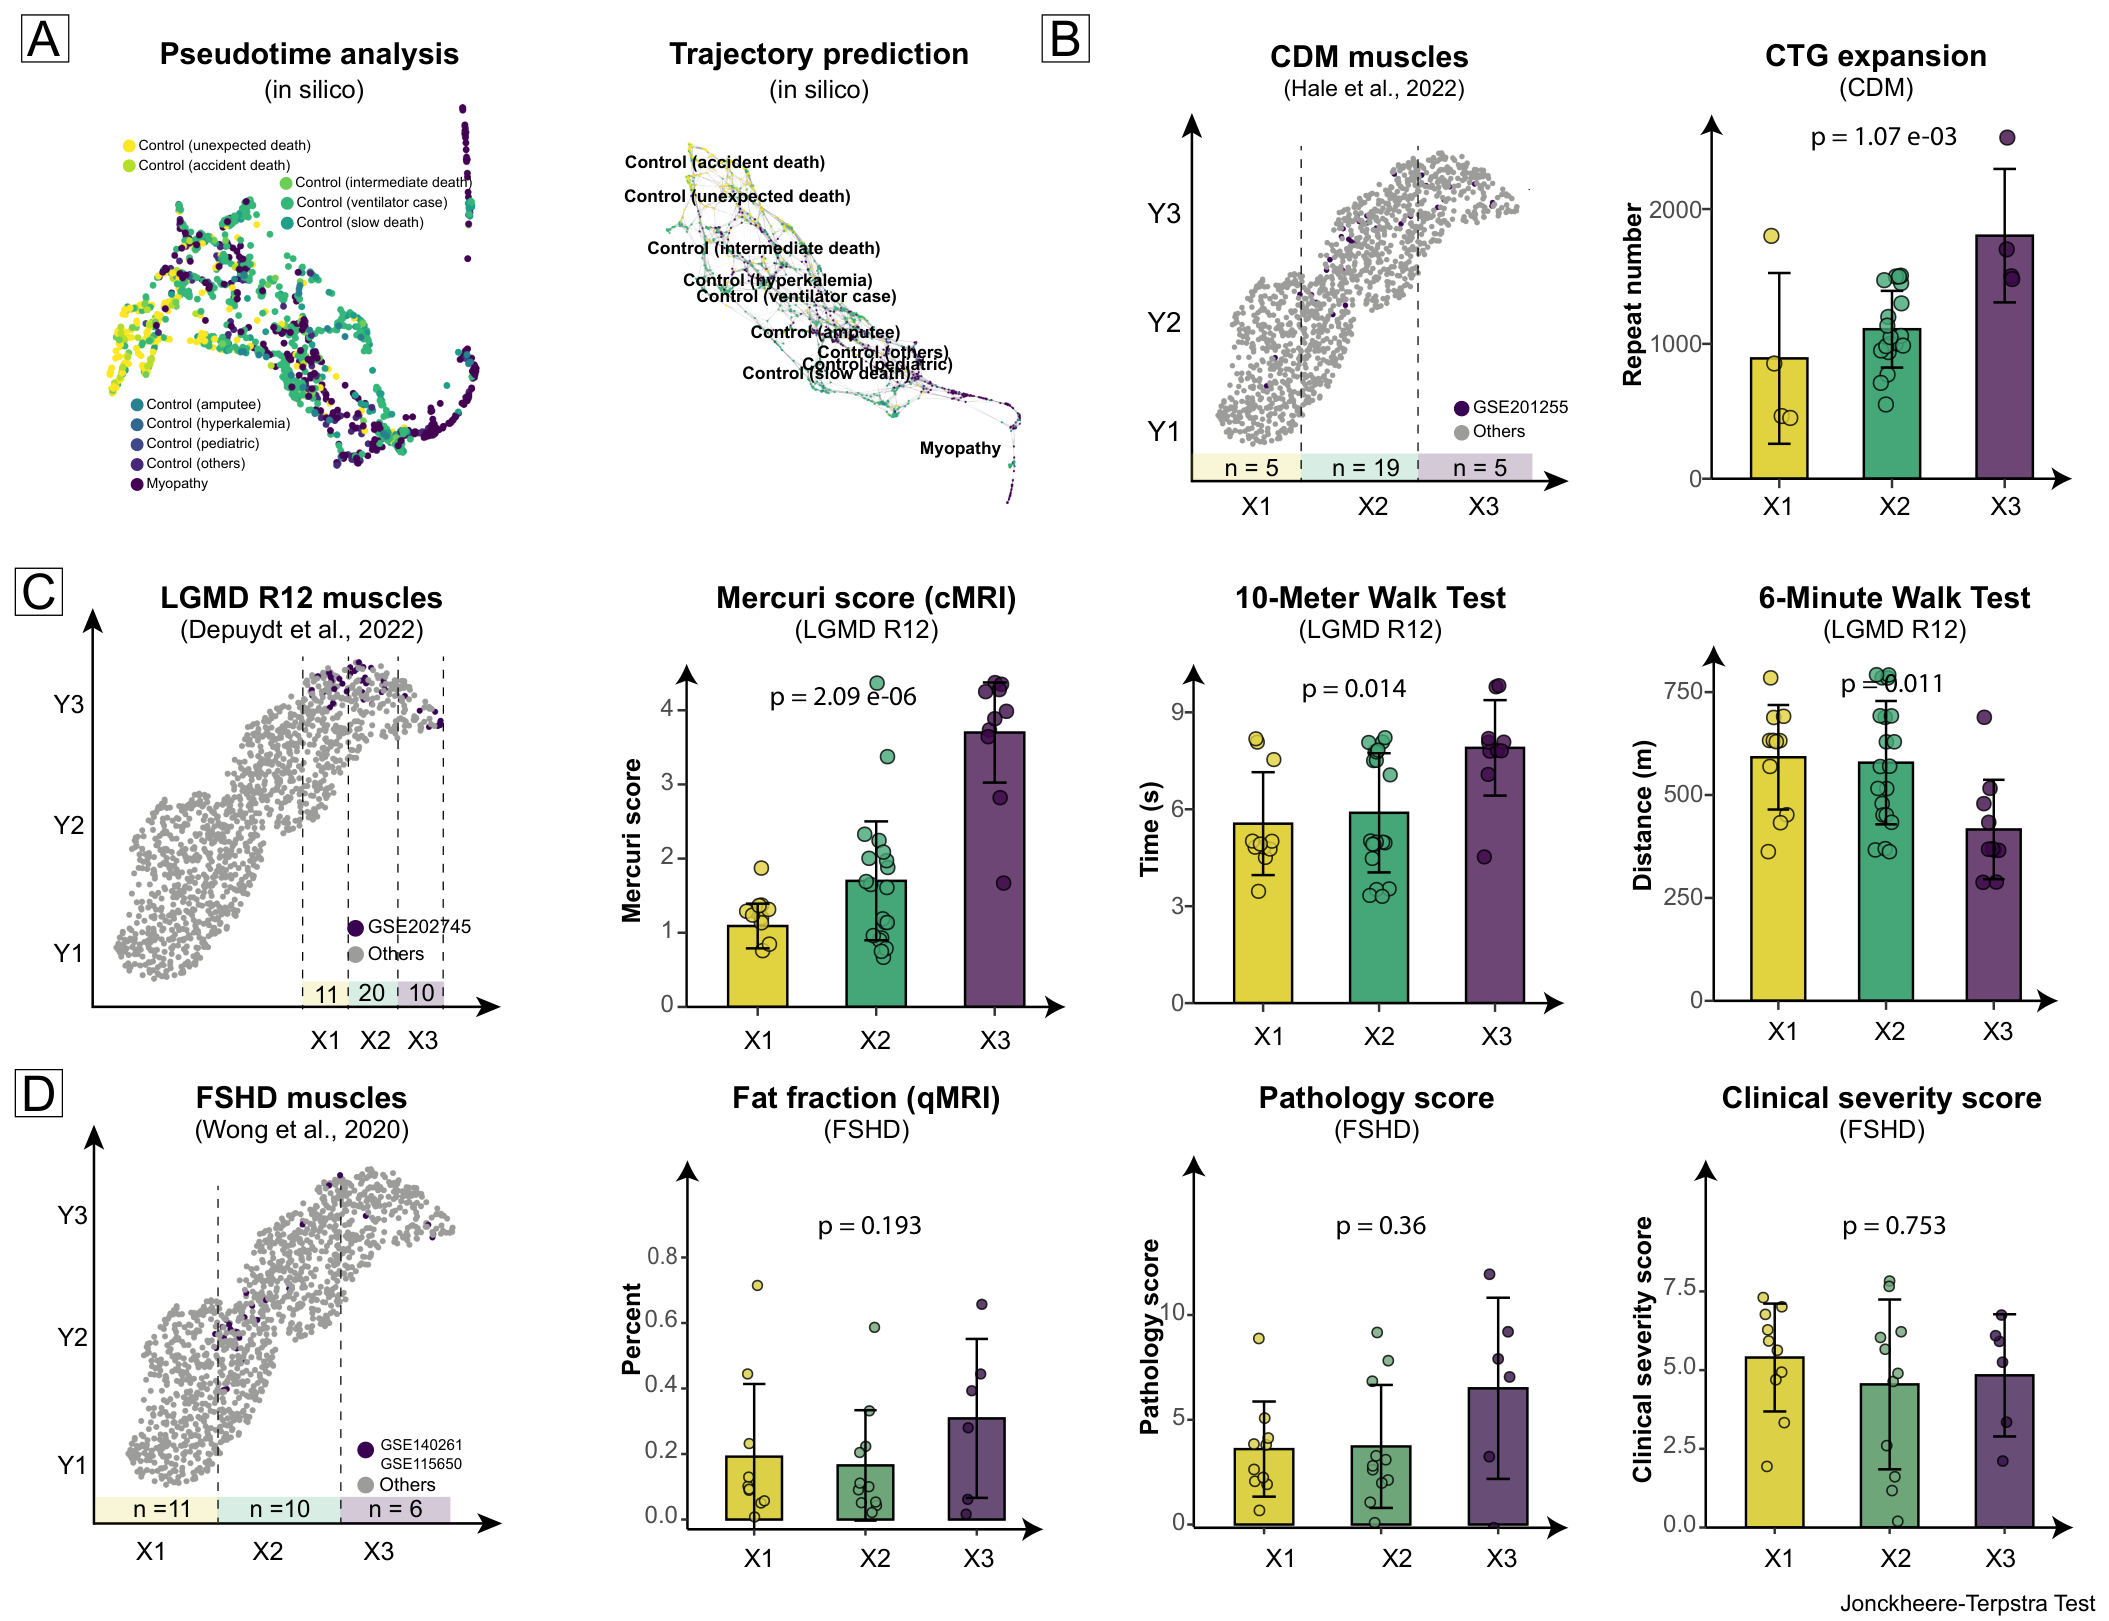
Both data-level simulations and clinical feature associations across different myopathies showed the same stepwise disease progression as the myopathy spectrum:
| Myopathy | Clinical Feature | p-value | Result |
|---|---|---|---|
| CDM | CTG repeat expansion (peripheral blood) | 1.07e-03 | Significant stepwise progression |
| LGMD R12 | Mercuri score (conventional MRI) | 2.09e-06 | Significant stepwise progression |
| LGMD R12 | 10-meter walk test | 0.014 | Significant stepwise progression |
| LGMD R12 | 6-minute walk test | 0.011 | Significant stepwise progression |
| FSHD | Fat fraction (quantitative MRI) | 0.193 | Consistent trend |
| FSHD | Pathology score | 0.36 | Consistent trend |
| FSHD | Clinical severity score | 0.753 | Consistent trend |
About FSHD
Only CDM and LGMD R12 showed more pronounced stepwise progression, likely related to biopsy muscle heterogeneity. CDM and LGMD R12 were biopsied from the same muscle (e.g., vastus lateralis), while FSHD samples came from diverse sources (tibialis anterior, gastrocnemius, portions of quadriceps or biceps femoris).
Featured Genes & qPCR Validation
Using 234 very healthy GTEx muscles as a novel healthy control, DEG analysis on the integrated data yielded transcriptional signatures for each myopathy type.
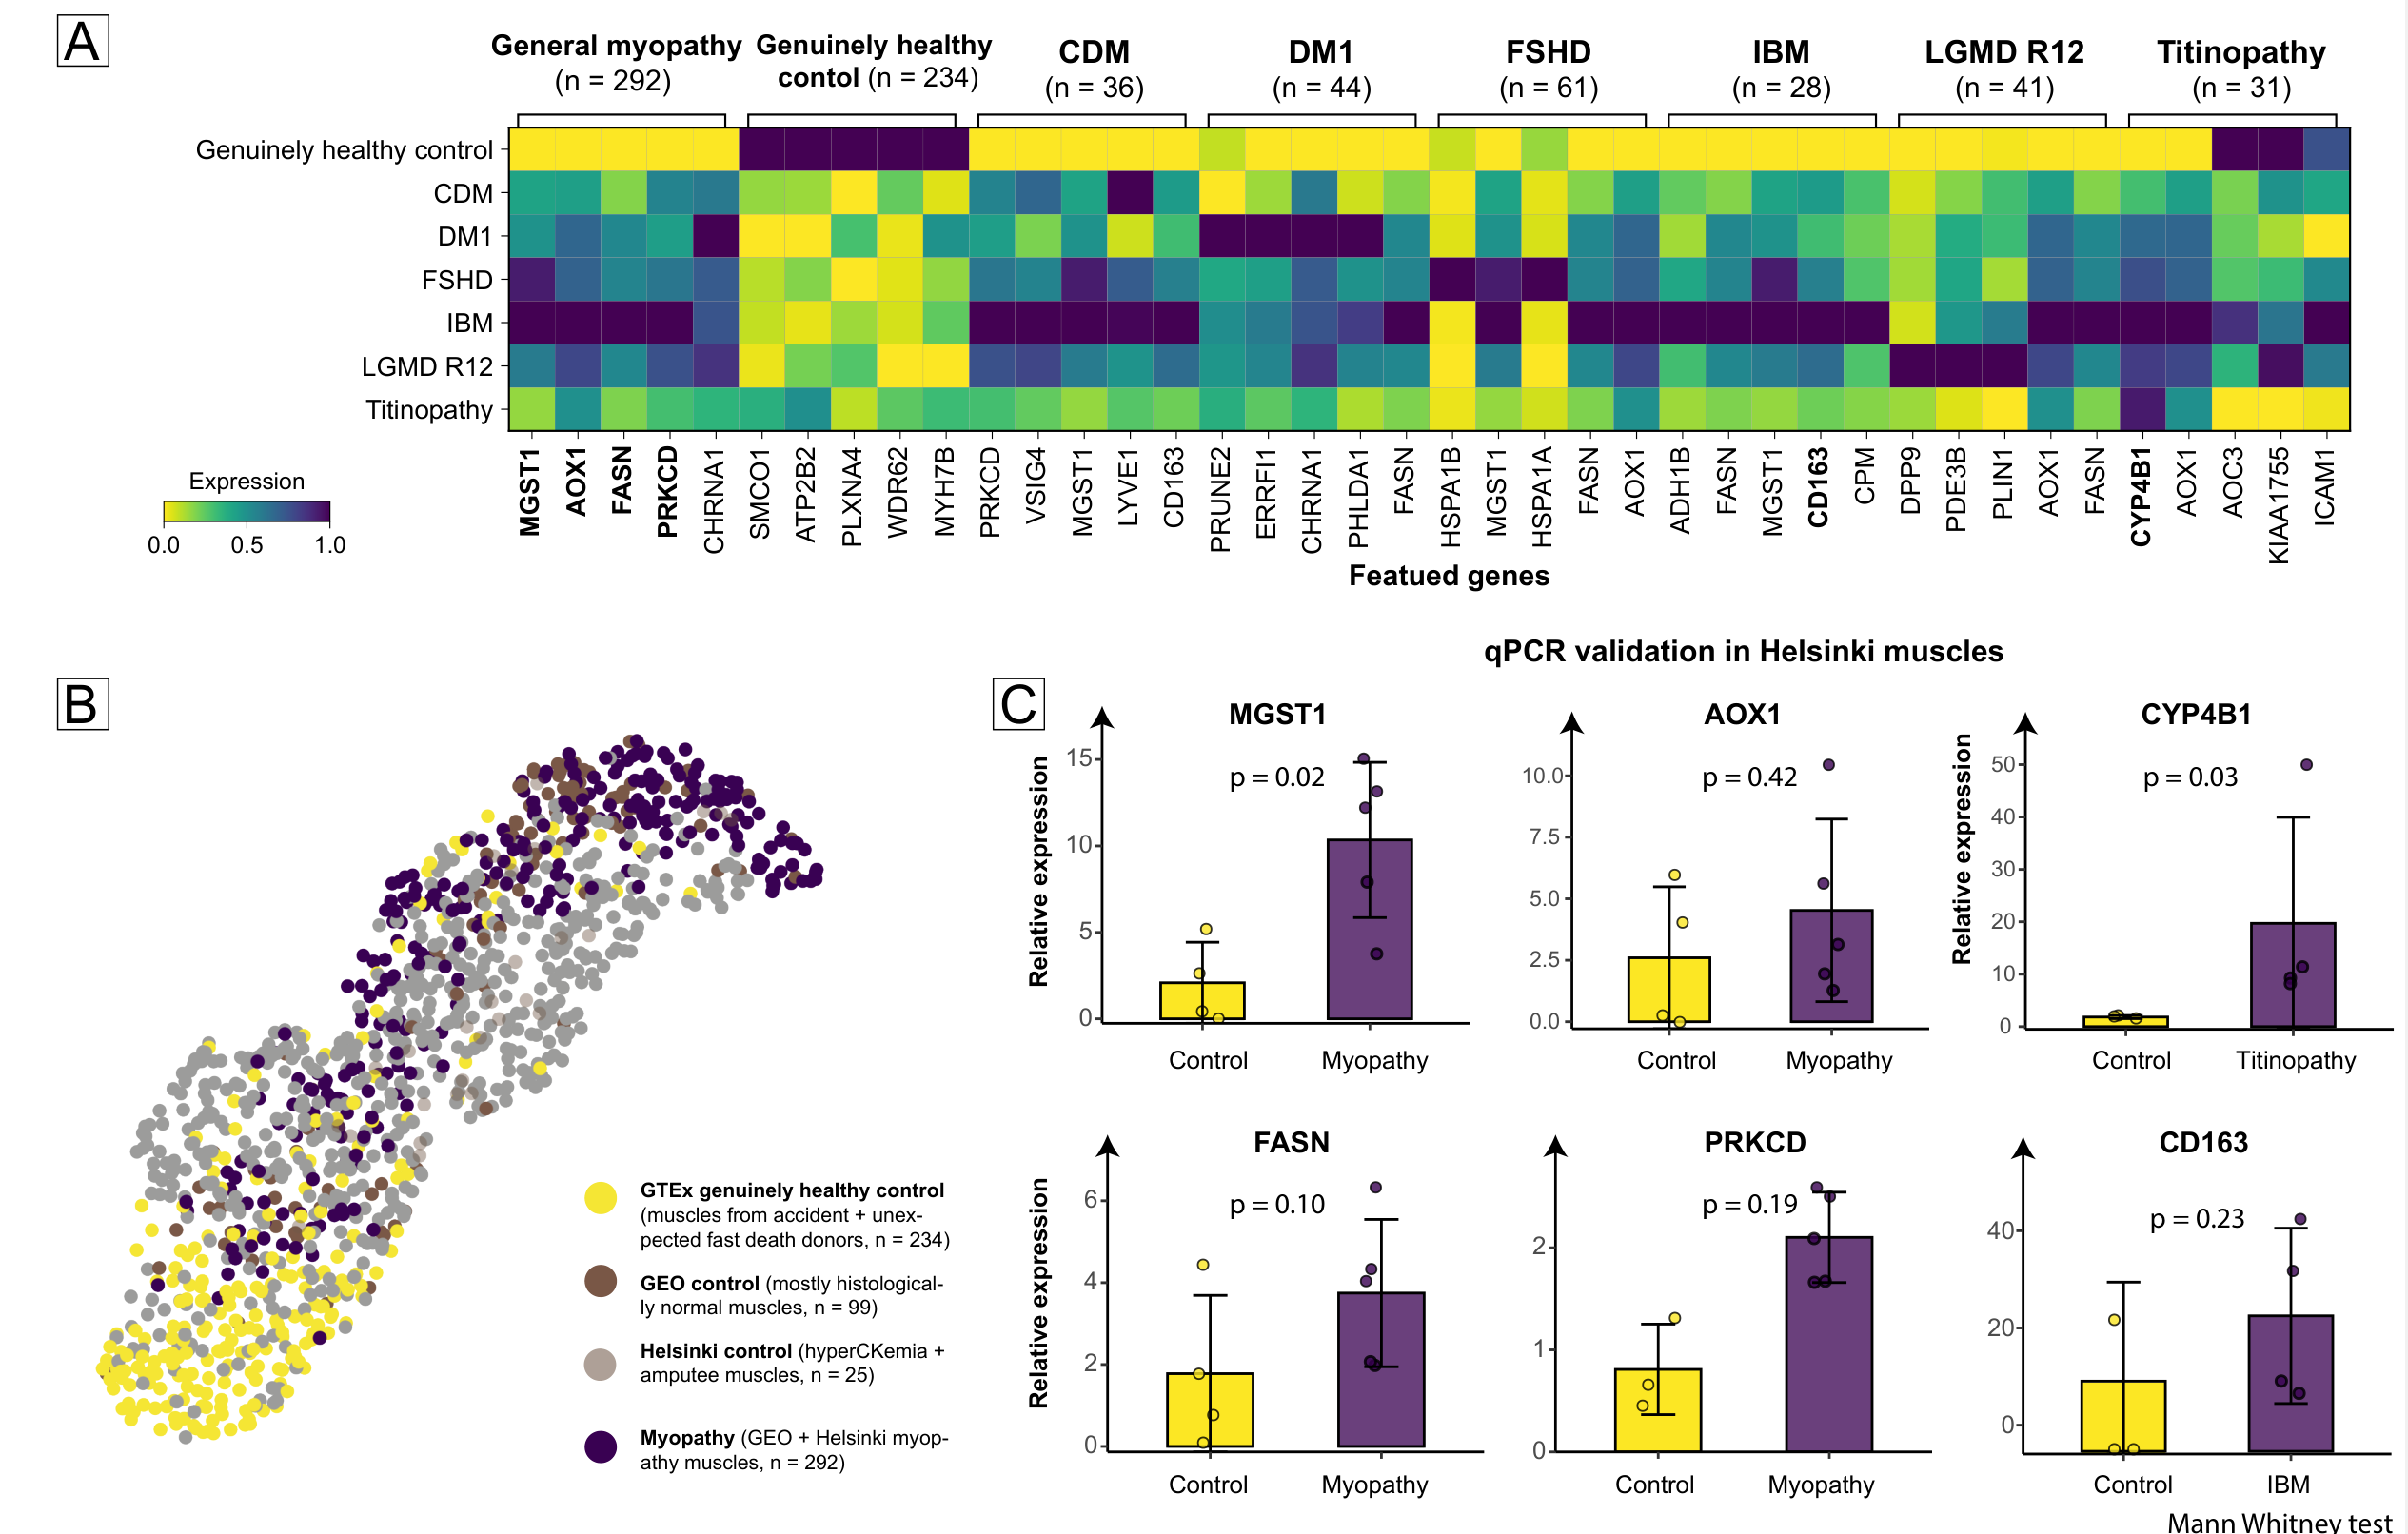
About Control Selection
For ethical reasons, neither Helsinki control muscles (from hyperCKemia and diabetic amputee patients) nor GEO control muscles (histologically normal muscles from suspected myopathy patients) occupy a truly healthy position — they fall in the intermediate, not-quite-healthy range. The 234 very healthy muscles at the bottom (from donors without known diseases) serve as a novel healthy control.
Top 5 up-regulated genes in general myopathy:
| Gene | Full Name | Function |
|---|---|---|
| MGST1 | Microsomal Glutathione S-Transferase 1 | Protection against oxidative stress, potential role in aging |
| AOX1 | Aldehyde Oxidase 1 | Contributor to myogenesis |
| FASN | Fatty Acid Synthase | Marker of fat infiltration in myopathic muscles |
| PRKCD | Protein Kinase C Delta | Regulation of lipogenesis |
| CHRNA1 | Cholinergic Receptor Nicotinic Alpha 1 | Increases in aging skeletal muscle, induces sarcopenia |
MGST1, AOX1, FASN, PRKCD, and CYP4B1 — these five genes had never been reported as significant in prior myopathy studies, yet were found to be differentially expressed in cell and animal models, suggesting that controls used in current myopathy research are not truly "healthy."
Helsinki muscle qPCR validation:
- General myopathy: MGST1 (RQ 10.34/2.09, p = 0.02), AOX1, FASN, PRKCD
- Titinopathy: CYP4B1 (RQ 19.71/1.41, p = 0.03)
- IBM: CD163 (RQ 27.87/10.05, p = 0.23)
Pathway analysis indicates that myopathies primarily affect metabolism-related pathways.
Tissue Deconvolution
Using the TAPE deep learning autoencoder with two human skeletal muscle single-cell datasets (Tabula Sapiens and GSE143704) for tissue deconvolution:
- Myopathy groups showed fewer vasculature structure cell proportions, higher satellite stem cells, natural killer T cells, and fibroblast (tendon) cells
- Greater proportion of adipocytes and COL1A+ fibroblasts were found in myopathy groups
Comparison with Published Results
Re-analyzing both integrated data and raw data from published studies using the same software pipeline revealed a "pyramid" pattern in muscle sequencing results:
- Top-tier highly differentially expressed genes are nearly unaffected by sample size or control changes
- Bottom-tier differentially expressed genes shift continuously with these factors
Featured genes were consistently preserved across different control phenotype comparisons (FSHD 80%, LGMD R12 80%, IBM 73.3%), with retention rates increasing to 100% when sample sizes were expanded.
Conclusions
- Unprecedented controls: Identified 234 genuinely healthy GTEx muscles as a novel control group
- Continuous spectrum: The transcriptomic landscape reveals continuous disease progression from healthy to severe myopathy
- Novel featured genes: MGST1, AOX1, FASN, PRKCD, and CHRNA1 were rarely reported in previous myopathy studies
- Clinical correlation: The transcriptional spectrum aligns with CTG repeats, MRI fat infiltration, walk tests, and other clinical features
Limitations
- The integration process itself introduces interference in results, particularly given the substantial heterogeneity of this dataset
- Due to ethical constraints, experimental validation lacked "healthy" muscle controls and could only use "histologically healthy" muscles as substitutes
- Muscle selection for biopsies also introduces variability in results
- Flow cytometry or large-scale single-cell datasets could better characterize muscle composition
Publication
Zhong, H., Sian, V., Johari, M., Katayama, S., Oghabian, A., Jonson, P. H., Hackman, P., Savarese, M., & Udd, B. Revealing myopathy spectrum: integrating transcriptional and clinical features of human skeletal muscles with varying health conditions. Communications Biology, 2024, 7(1):438. DOI
Acknowledgments
We thank the participants and their families who donated their muscle tissues for research purposes. We would also like to extend special thanks to the authors of these publicly available muscle datasets, which will facilitate further research in the future. Funding support: FHRC (M.S. and M.J.), Academy of Finland (M.S.), Jane and Aatos Erkko foundation (P.H.), Magnus Ehrnrooth foundation (A.O.), AFM Téléthon (M.J.), China Scholarship Council (H.Z.). The funders had no role in the design and conduct of the study; collection, management, analysis, and interpretation of the data; preparation, review, or approval of the manuscript; and decision to submit the manuscript for publication.
Source Code
- GitHub: Hirriririir/MyoSpectrum