
Methods
Analysis Pipeline
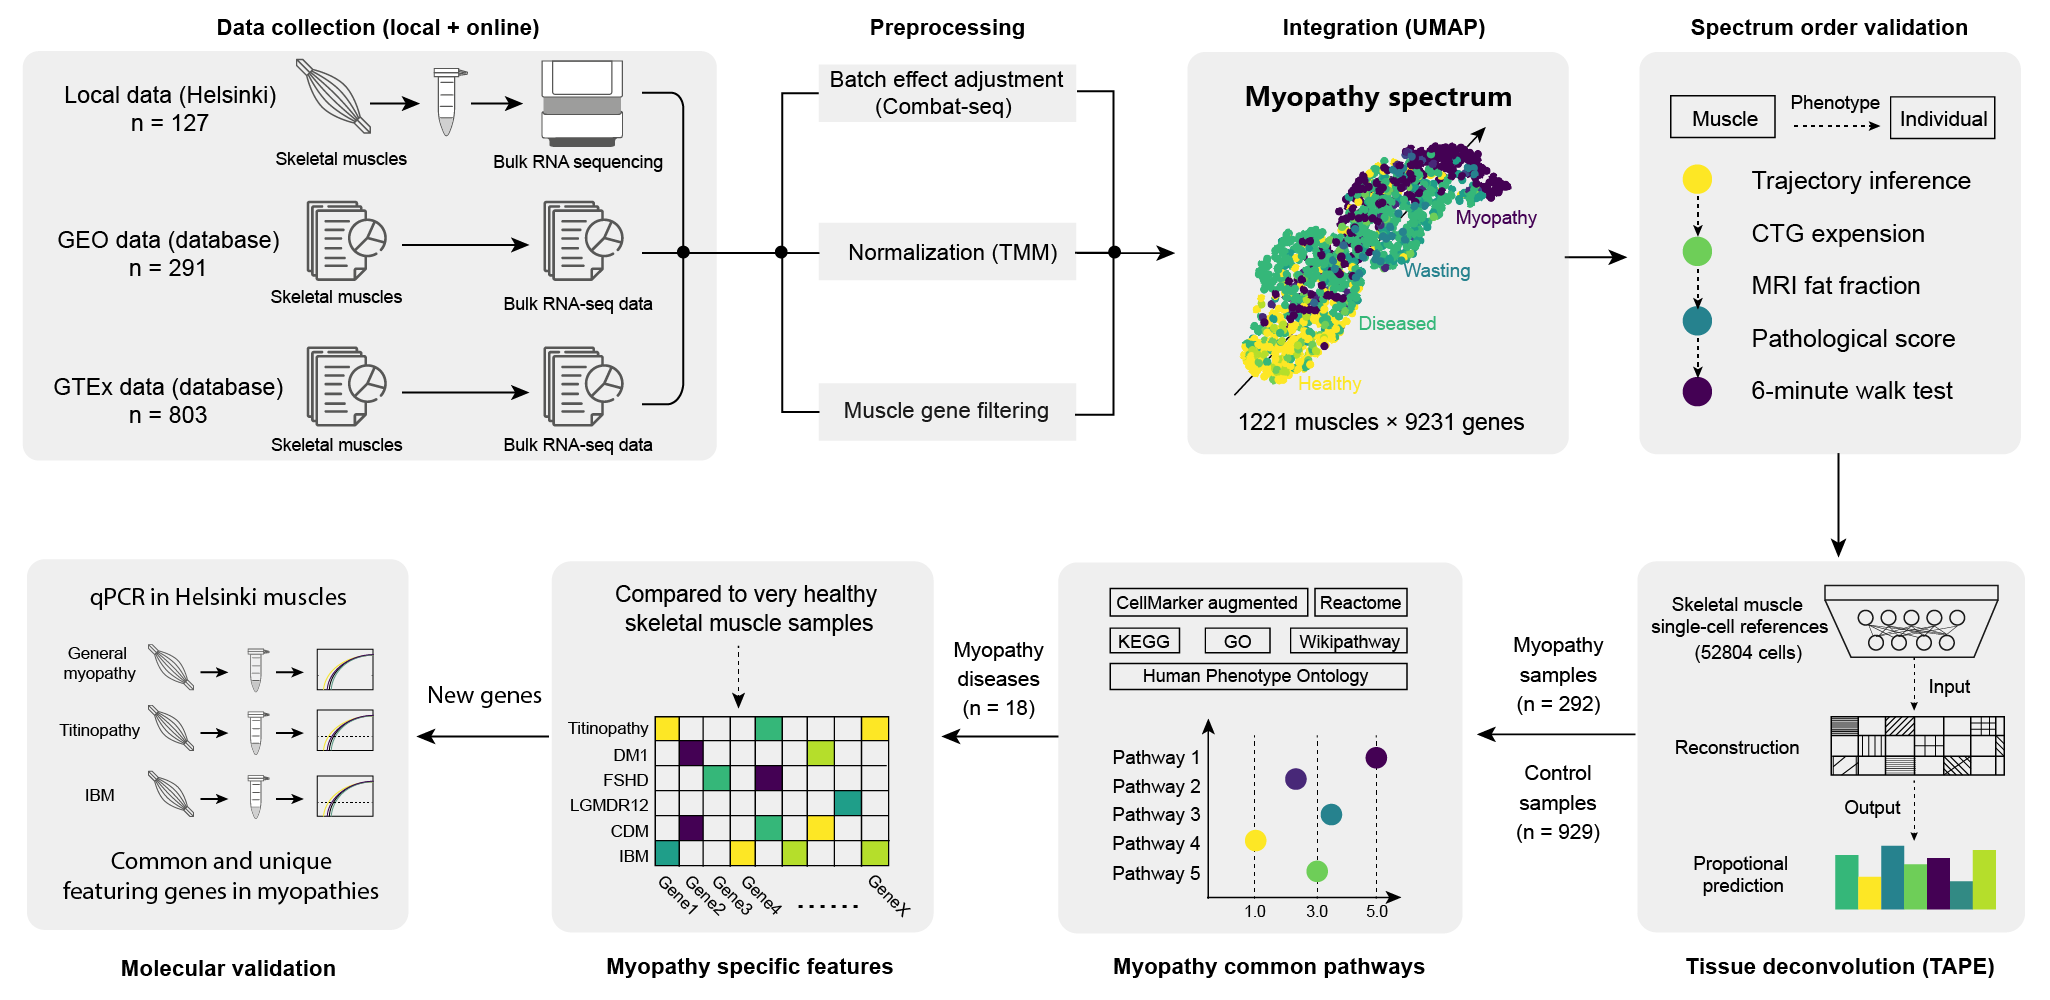
Data Collection (3 sources)
  → Preprocessing (ComBat-seq + TMM normalization + gene filtering)
    → Integration (Scanpy PCA + UMAP)
      → Spectrum Order Validation (PAGA trajectory + clinical features)
      → Tissue Deconvolution (TAPE)
      → DEG Analysis (EdgeR)
      → Pathway Enrichment (gseapy)
→ Molecular Validation (qPCR)Inclusion/Exclusion Criteria
Three strict criteria governed sample selection:
- Only human skeletal muscle tissue accepted (excluding cell lines or organoids)
- Bulk RNA-seq performed using high-throughput techniques (no microarray or single-cell data)
- Raw count data preserved in original format (no transformed count format)
Data Sources
| Source | Samples | Accession |
|---|---|---|
| GTEx | 803 | dbGaP phs000424.v8.p2 |
| GEO | 291 | GSE115650, GSE175861, GSE184951, GSE201255, GSE202745, GSE140261 |
| Helsinki | 127 | Local data (39 also in GSE151757) |
Preprocessing
Batch Effect Adjustment
- Method: ComBat-seq (negative-binomial regression-based batch adjustment)
- R package: sva
- Batch variables: Sequencing platform — 930 mRNA (polyA) vs. 291 total RNA (ribosomal)
Normalization
- Method: TMM (Trimmed Mean of M-values) via conorm
- Better suited for between-sample comparisons than TPM/FPKM
Gene Filtering
- Initial gene sets: 16,953 candidate genes across all 1,221 samples
- Filtering rule: muscle-specific gene counts must be > 0 in all samples
- Final: 9,231 genes selected
Integration & Visualization
- Tool: Scanpy (Python)
- Pipeline: PCA → UMAP (single-cell-like analysis applied to bulk data)
- Key insight: Similar expression patterns cluster together; myopathy muscles show a ribbon-like distribution rather than compact clusters
Spectrum Order Validation
In-Silico Validation
- Pseudo-time analysis (PAGA) used to predict muscle deterioration transformation from healthy to myopathy
- Trajectory prediction algorithms confirmed the severity spectrum order
Clinical Feature Mapping
Clinical features mapped onto UMAP to validate the spectrum order:
| Myopathy | Clinical Feature | Jonckheere Test | p-value |
|---|---|---|---|
| CDM | CTG repeat expansion | JT = 181 | 1.07e-03 |
| LGMD R12 | Mercuri score (cMRI) | JT = 459 | 2.09e-06 |
| LGMD R12 | 10-meter walk test | JT = 369 | 0.011 |
| LGMD R12 | 6-minute walk test | JT = 164 | 0.014 |
| FSHD | Fat fraction (qMRI) | JT = 139 | 0.193 |
| FSHD | Pathology score | JT = 147 | 0.36 |
| FSHD | Clinical severity score | JT = 125 | 0.753 |
Differential Expression Analysis
- Tool: EdgeR (R)
- Reference: Genuinely healthy controls from GTEx (n = 234, accident + unexpected death)
- Thresholds: |log2FC| > 0.5 and FDR < 0.05
- Results: For general myopathy (n = 292) vs. genuinely healthy (n = 234): 200 up-regulated and 568 down-regulated genes
Cell-Type Deconvolution (TAPE)
- Tool: TAPE (deep-learning-based autoencoder)
- Reference datasets:
- Tabula Sapiens (30,746 cells)
- GSE143704 (22,058 cells)
- Comparison: Five control groups vs. myopathy groups
- Findings: Fewer vasculature cells, more adipocytes and COL1A+ fibroblasts in myopathy
Pathway Enrichment
- Tool: gseapy (Python)
- Databases: Human Phenotype Ontology, CellMarker Augmented, KEGG, GO, Reactome, WikiPathway
- Key pathways: Muscle contraction, lipoatrophy, myotube cell involvement, FATZ binding
qPCR Validation
- Tissue: Lower leg muscle biopsies from Helsinki (13 patients + 6 controls)
- Method: RT-qPCR with SYBR Green, normalized to 18S
- Validated genes:
- General myopathy: MGST1, AOX1, FASN, PRKCD
- IBM: CD163
- Titinopathy: CYP4B1
Software Versions
| Tool | Version | Purpose |
|---|---|---|
| Python | 3.8.1 | Main analysis |
| R | 4.2.2 | DEG and statistics |
| Scanpy | — | Integration & UMAP |
| EdgeR | — | Differential expression |
| ComBat-seq | — | Batch correction |
| TAPE | — | Cell-type deconvolution |
| gseapy | — | Pathway enrichment |
| DescTools | — | Jonckheere trend test |
| conorm | — | TMM normalization |